Dashboard Overview
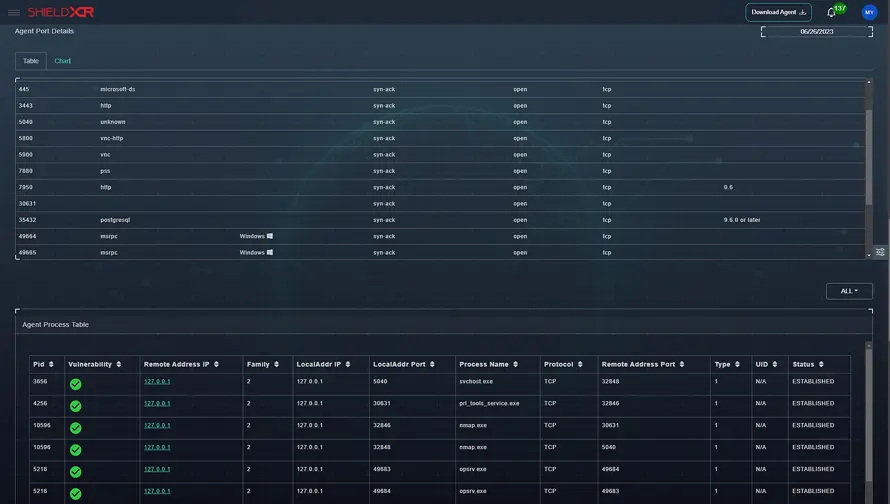
A business’s network’s IP-related actions, events, and threats are centrally shown on an XDR (Extended Detection and Response) IP surveillance output dashboard. The dashboard combines data from numerous sources, including intrusion detection systems, firewalls, network security appliances, and endpoint agents, for real-time insight into IP traffic and possible security issues.
Regardless of the XDR platform or solution used, an XDR IP surveillance output dashboard’s unique design and elements may change. However, the following are some typical components you might see in such an interface.
a) Overview: The general part of the dashboard typically opens with a high-level summary of the IP monitoring operations. Key indicators, including the total IP interactions, threats discovered, and traffic trends, may be included.
b) Incident Tracking: A list of current or previously resolved IP-related safety problems is shown on the dashboard here. Each incident record may contain information about the attack’s kind, affected systems, source, destination IP address, etc.
c) Alerting and Notifications: This dashboard section mainly focuses on real-time notifications and alerts associated with IP monitoring. It might draw attention to urgently needed security incidents, rule violations, or unusual IP activity.


